plot_ortho3D
- deepinv.utils.plot_ortho3D(img_list, titles=None, save_dir=None, tight=True, max_imgs=4, rescale_mode='min_max', show=True, return_fig=False, figsize=None, suptitle=None, cmap='gray', fontsize=17, interpolation='nearest')[source]
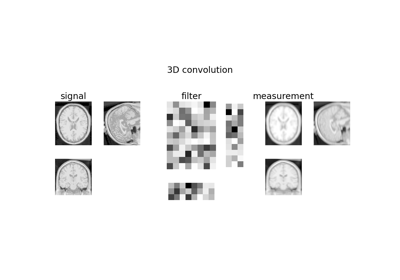
Plots an orthogonal view of 3D images.
The images should be of shape [B, C, D, H, W] or [C, D, H, W], where B is the batch size, C is the number of channels, D is the depth, H is the height and W is the width. The images are plotted in a grid, where the number of rows is B and the number of columns is the length of the list. If the B is bigger than max_imgs, only the first batches are plotted.
Warning
If the number of channels is 2, the magnitude of the complex images is plotted. If the number of channels is bigger than 3, only the first 3 channels are plotted.
Example usage:
import torch
from deepinv.utils import plot_ortho3D
img = torch.rand(2, 3, 8, 16, 16)
plot_ortho3D(img)
- Parameters:
img_list (list[torch.Tensor], torch.Tensor) – list of images to plot or single image.
titles (list[str]) – list of titles for each image, has to be same length as img_list.
save_dir (None, str, Path) – path to save the plot.
tight (bool) – use tight layout.
max_imgs (int) – maximum number of images to plot.
rescale_mode (str) – rescale mode, either ‘min_max’ (images are linearly rescaled between 0 and 1 using their min and max values) or ‘clip’ (images are clipped between 0 and 1).
show (bool) – show the image plot.
return_fig (bool) – return the figure object.
suptitle (str) – title of the figure.
cmap (str) – colormap to use for the images. Default: gray
fontsize (int) – fontsize for the titles. Default: 17
interpolation (str) – interpolation to use for the images. See https://matplotlib.org/stable/gallery/images_contours_and_fields/interpolation_methods.html for more details. Default: none
