plot_inset#
- deepinv.utils.plot_inset(img_list, titles=None, save_fn=None, save_dir=None, tight=True, max_imgs=4, rescale_mode='min_max', show=True, figsize=None, suptitle=None, subtitles=None, cmap='gray', fontsize=17, interpolation='none', cbar=False, dpi=1200, fig=None, axs=None, labels=(), label_loc=(0.03, 0.03), extract_loc=(0.0, 0.0), extract_size=0.2, inset_loc=(0.0, 0.5), inset_size=0.4, return_fig=False, return_axs=False)[source]#
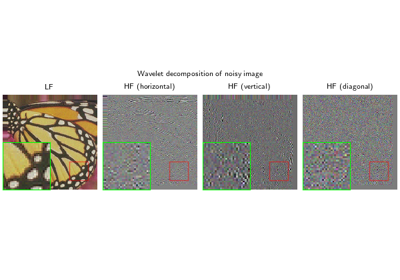
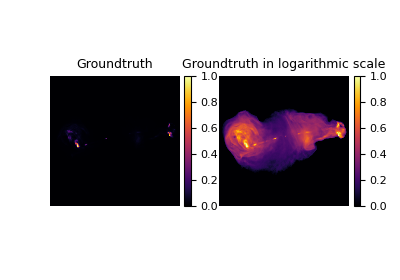
Plots a list of images with zoomed-in insets extracted from the images.
Deprecated since version This: function is deprecated and will be removed in a future version. Use
plot()withplot_inset=Trueinstead, which has the same functionality.The inset taken from extract_loc and shown at inset_loc. The coordinates extract_loc, inset_loc, and label_loc correspond to their top left corners taken at (horizontal, vertical) from the image’s top left.
Each loc can either be a tuple (float, float) which uses the same loc for all images across the batch dimension, or a list of these whose length must equal the batch dimension.
Coordinates are fractions from 0-1, (0, 0) is the top left corner and (1, 1) is the bottom right corner.
- Parameters:
img_list (list[torch.Tensor], dict[str,torch.Tensor], torch.Tensor) – list of images, single image, or dict of titles: images to plot.
titles (list[str], str, None) – list of titles for each image, has to be same length as img_list.
save_fn (None, str, pathlib.Path) – path to save the plot as a single image (i.e. side-by-side).
save_dir (None, str, pathlib.Path) – path to save the plots as individual images.
tight (bool) – use tight layout.
max_imgs (int) – maximum number of images to plot.
rescale_mode (str) – rescale mode, either
'min_max'(images are linearly rescaled between 0 and 1 using their min and max values) or'clip'(images are clipped between 0 and 1).show (bool) – show the image plot. Under the hood, this calls the
plt.show()function.figsize (tuple[int]) – size of the figure. If
None, calculated from the size ofimg_list.subtitles (list[list[str]], list[str], str, None) – list of subtitles for each image, can be either the same length or the same shape as img_list.
suptitle (str) – title of the figure.
cmap (str) – colormap to use for the images. Default: gray
fontsize (int) – fontsize for the plot. Default: 17
interpolation (str) – interpolation to use for the images. See https://matplotlib.org/stable/gallery/images_contours_and_fields/interpolation_methods.html for more details. Default: none
cbar (bool) – whether to add colorbar to the images.
dpi (int) – DPI to save images.
fig (None, matplotlib.figure.Figure) – matplotlib Figure object to plot on. If None, create new Figure. Defaults to None.
axs (None, matplotlib.axes.Axes) – matplotlib Axes object to plot on. If None, create new Axes. Defaults to None.
labels (list[str]) – list of overlaid labels for each image, has to be same length as img_list.
label_loc (list, tuple) – location or locations for label to be plotted on image, defaults to (.03, .03)
extract_loc (list, tuple) – image location or locations for extract to be taken from, defaults to (0., 0.)
extract_size (float) – size of extract to be taken from image, defaults to 0.2
inset_loc (list, tuple) – location or locations for inset to be plotted on image, defaults to (0., 0.5)
inset_size (float) – size of inset to be plotted on image, defaults to 0.4
return_fig (bool) – return the figure object.
return_axs (bool) – return the axs object.